Time Series Dataset: Electricity
This dataset is provided as the "ElectricityLoadDiagrams20112014 Data Set" on the UCI website. It is the time series of electricity consumption of 370 points/clients.
We download the time series data in zip format using this link.
We find that
- in total 140256 rows and 370 series,
- the earliest time is 2011-01-01 00:15:00,
- the latest time is 2015-01-01 00:00:00,
- a fixed time interval of 15 minutes.
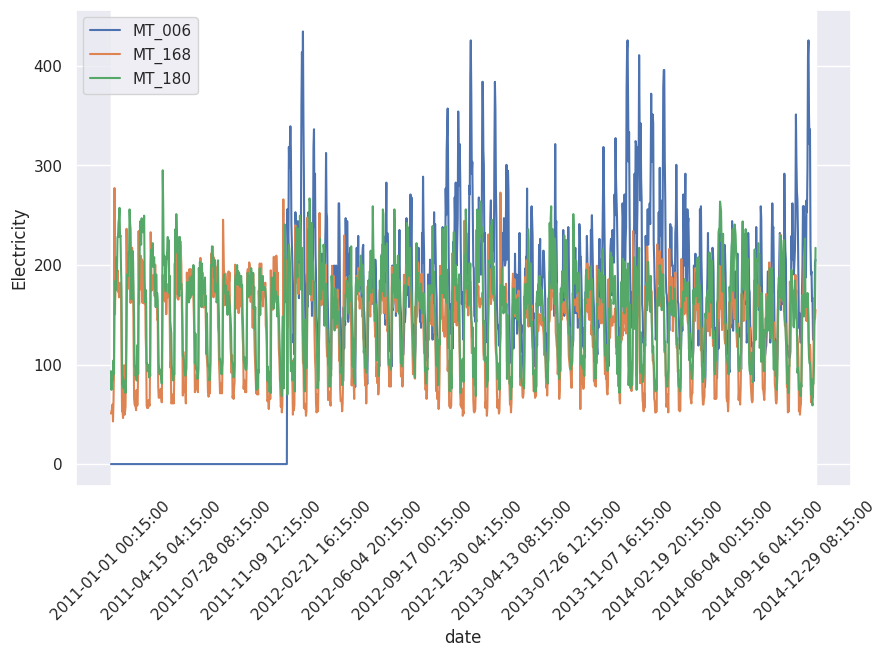
We only plot out three series. We only plot every 100 time steps.

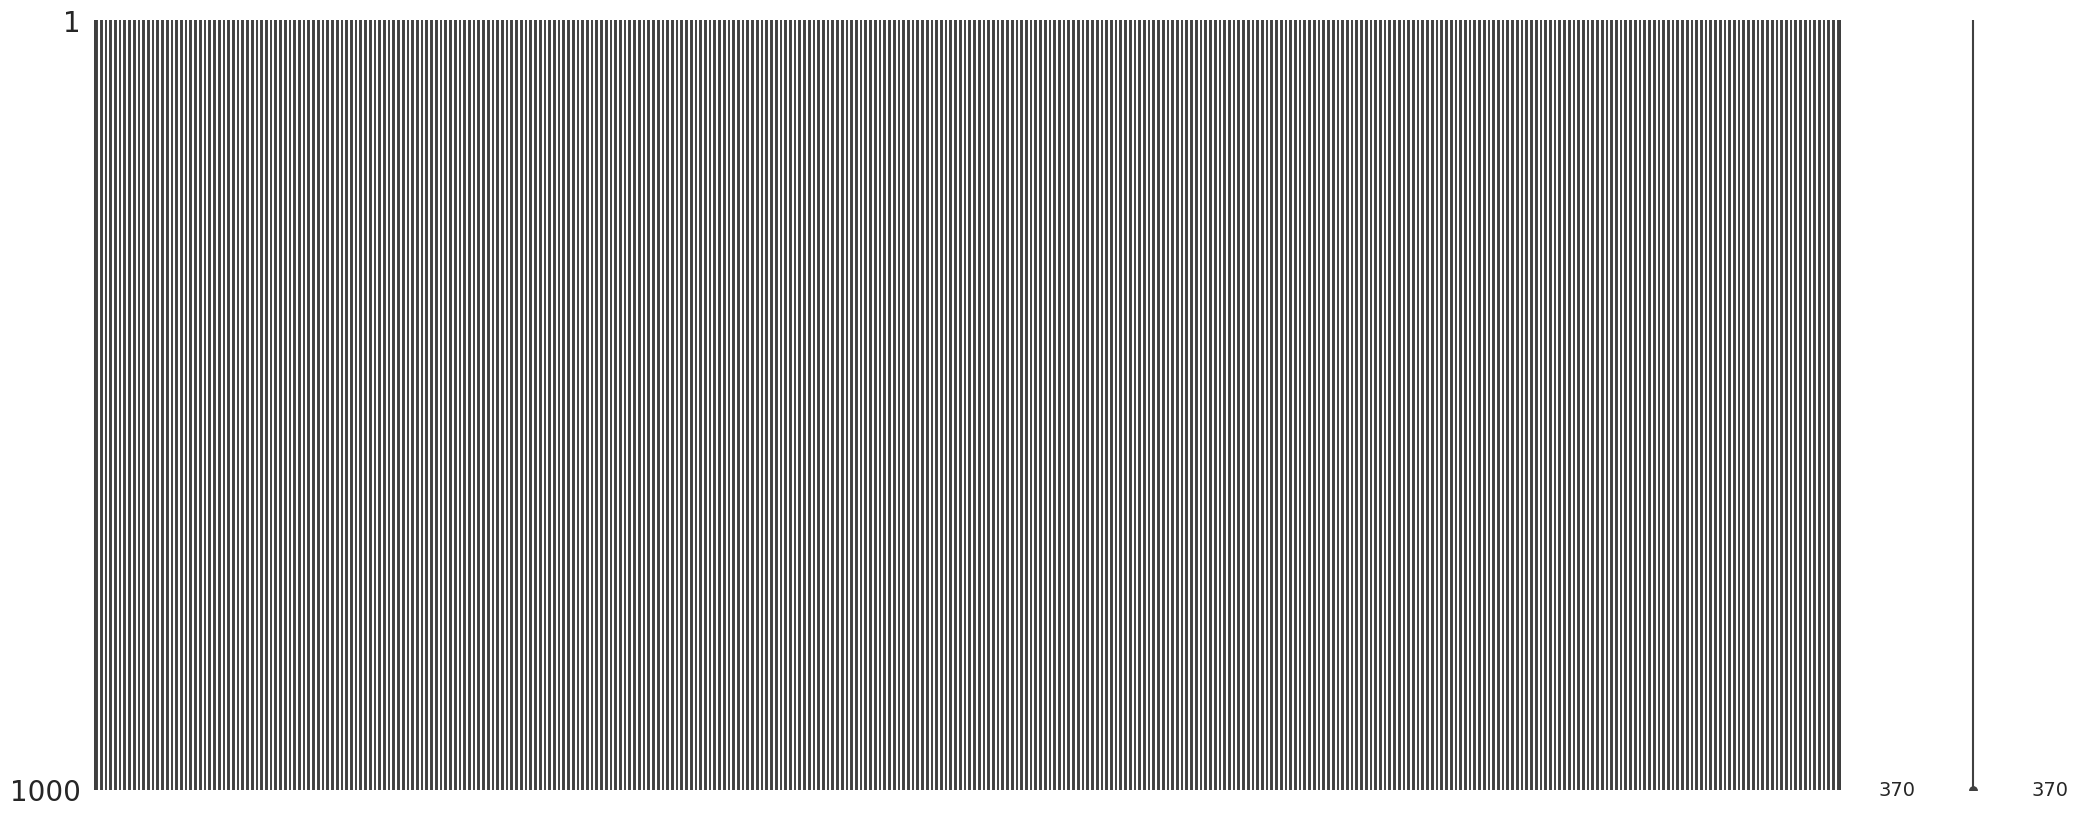
We fine no missing values.

Loading and Basic Cleaning
We provide some code to load the data from the UCI website.
import requests, zipfile, io
import pandas as pd

# Download from remote URL
data_uri = "https://archive.ics.uci.edu/ml/machine-learning-databases/00321/LD2011_2014.txt.zip"

r = requests.get(data_uri)

z = zipfile.ZipFile(io.BytesIO(r.content))
z.extractall("data/uci_electricity/")

# Load as pandas dataframe
df = pd.read_csv(
    "data/uci_electricity/LD2011_2014.txt", delimiter=";", decimal=','
).rename(columns={"Unnamed: 0": "date"}).set_index("date")
df.index = pd.to_datetime(df.index)
Contributors: