Time Series Data and Statistical Forecasting Mothods
Time Series Data
Time series data comes from a variety of data generating processes. There are also different formulations and views of time series data.
Time series data can be formulated as a sequence of vector functions of time 1. There are many different types of tasks on time series data, for example,
- classification,
- anomaly detection, and
- forecasting.
In this chapter, we focus on the forecasting problem.
The Forecasting Problem
To make it easier to formulate the forecasting problem, we group the time series features based on the role they play in a forecasting problem. Given a dataset \(\mathcal D\), with
- \(y^{(i)}_t\), the sequential variable to be forecasted,
- \(x^{(i)}_t\), exogenous data for the time series data,
- \(u^{(i)}_t\), some features that can be obtained or planned in advance,
where \({}^{(i)}\) indicates the \(i\)th variable, \({}_ t\) denotes time. In a forecasting task, we use \(y^{(i)} _ {t-K:t}\), \(x^{(i) _ {t-K:t}}\), and \(u^{(i)} _ {t-K:t+H}\), to forecast the future \(y^{(i)} _ {t+1:t+H}\). In these notations, \(K\) is the input sequence length and \(H\) is the forecast horizon.
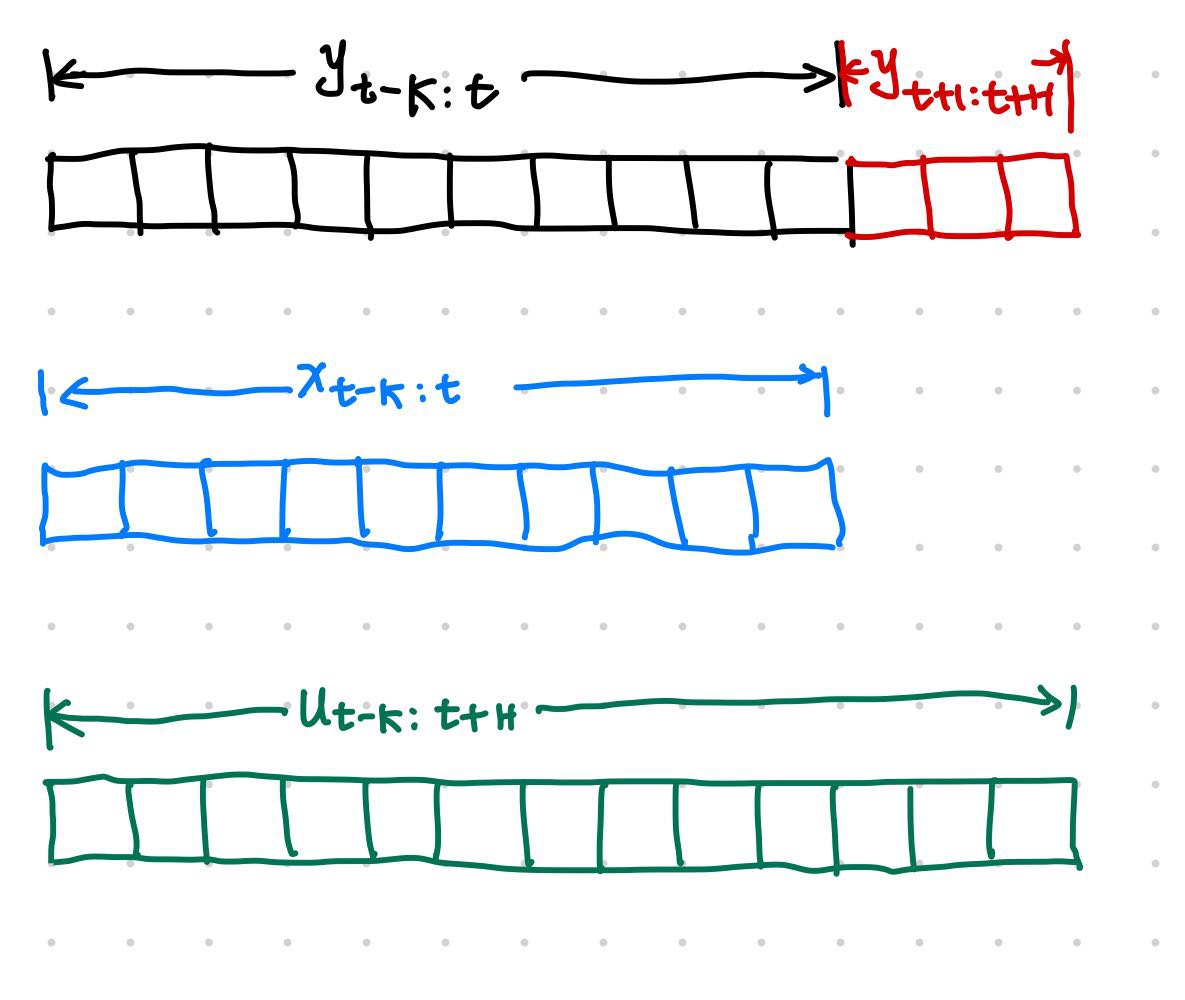
A forecasting model \(f\) will use \(x^{(i)} _ {t-K:t}\) and \(u^{(i)} _ {t-K:t+H}\) to forecast \(y^{(i)} _ {t+1:t+H}\).
In the section Time Series Forecasting Tasks, we will discuss more details of the forecasting problem.
Categories of Forecasting Methods
Januschowsk et al proposed a framework to classify the different forecasting methods2. We illustrate the different methods in the following charts. For simplicity, we simply merge all the possible dimensions in one chart.
flowchart LR
classDef subjective fill:#EE8866;
classDef objective fill:#77AADD;

dimensions["Dimensions of Forecasting Methods"]

%% Objective

params_shared["Parameter Shared Accross Series"]:::objective

params_shared --"True"-->Global:::objective
params_shared --"False"-->Local:::objective

uncertainty["Uncertainty in Forecasts"]:::objective
uncertainty --"True"--> Probabilistic["Probabilistic Forecasts:\n forecasts with predictive uncertainty"]:::objective
uncertainty --"False"--> Point["Point Forecasts"]:::objective

computational_complexity["Computational Complexity"]:::objective
linear_convexity["Linear and Convexity"]:::objective

dimensions --> params_shared
dimensions --> uncertainty
dimensions --> computational_complexity
dimensions --> linear_convexity


%% Subjective

structural_assumptions["Strong Structural Assumption"]:::subjective --"Yes"--> model_driven["Model-Driven"]:::subjective
structural_assumptions --"No"--> data_driven["Data-Driven"]:::subjective

model_comb["Model Combinations"]:::subjective

discriminative_generative["Discriminative or Generative"]:::subjective

theoretical_guarantees["Theoretical Guarantees"]:::subjective

predictability_interpretability["Predictability and Interpretibility"]:::subjective

dimensions --> structural_assumptions
dimensions --> model_comb
dimensions --> discriminative_generative
dimensions --> theoretical_guarantees
dimensions --> predictability_interpretability
We will mention those different dimensions later in our discussion of different forecasting models. For example, random forest is an ensemble method, which we will discuss in detail later.
-
Dorffner G. Neural networks for time series processing. Neural Network World 1996; 6: 447–468. ↩
-
Januschowski T, Gasthaus J, Wang Y, Salinas D, Flunkert V, Bohlke-Schneider M et al. Criteria for classifying forecasting methods. International journal of forecasting 2020; 36: 167–177. ↩